A rising tide lifts all boats. Was the rising tide the money supply from 2008 to 2021, providing the fuel for rising valuations? And is the money supply tide now going back out? Health IT Investment Value decreased 64% and Health IT M&A 30% as of Q1 2024 compared to Q1 2021. The private markets feel tighter, and it feels like the money supply is shrinking. But is it? How much did the money supply rise and how much will it fall? HGP takes a quick look at the interplay between monetary policy and market activity, with an emphasis on Health IT.
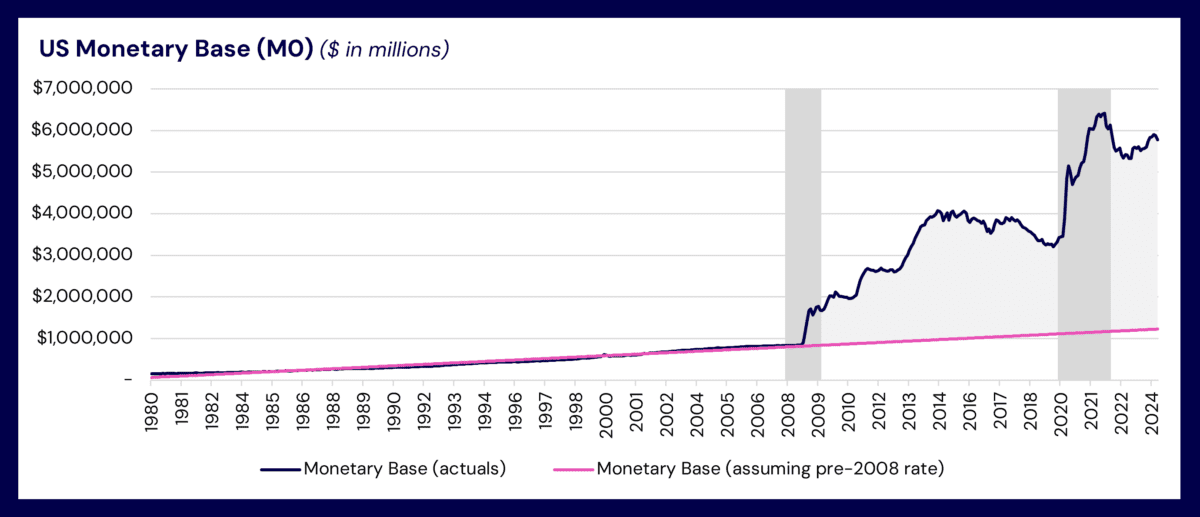
Following the 2008 financial crisis, the Federal Reserve implemented Quantitative Easing (QE) to stimulate the economy. This policy massively expanded the monetary base (M0), the most liquid form of money, to unprecedented and untested levels.
How did this explosive growth in the monetary base not spark inflation in the 10-years leading up to COVID? Three factors absorbed M0 without causing a spike in M2, the form of currency most closely tied to inflation. This, in turn, fueled a rise in stock and asset prices.
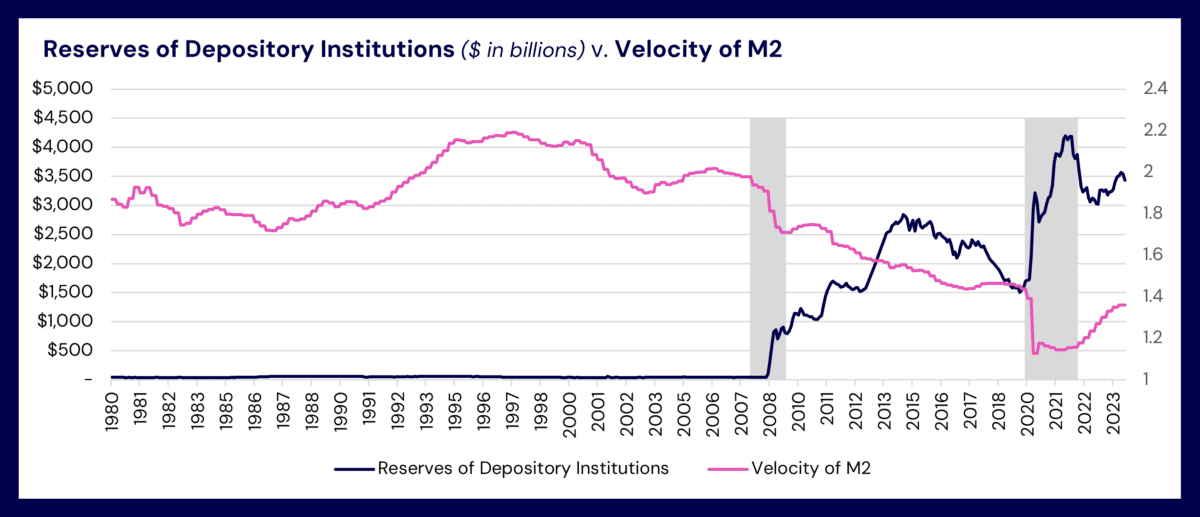
- Increased Bank Reserves: A significant portion of the expanded M0 went to bank reserves, providing banks with more capital to lend and decreasing the cost of capital.
- Declining Velocity of Money: The velocity of money (how often money changes hands) declined, mitigating inflation despite the increase in monetary base. This suggests a larger share of funds was used for saving or investing.
- Asset Price Appreciation: The combination of lower borrowing costs (due to QE) and lower velocity through investing and saving led to a rise in health IT valuations and other asset prices like stocks and real estate, thus, the rising tide.
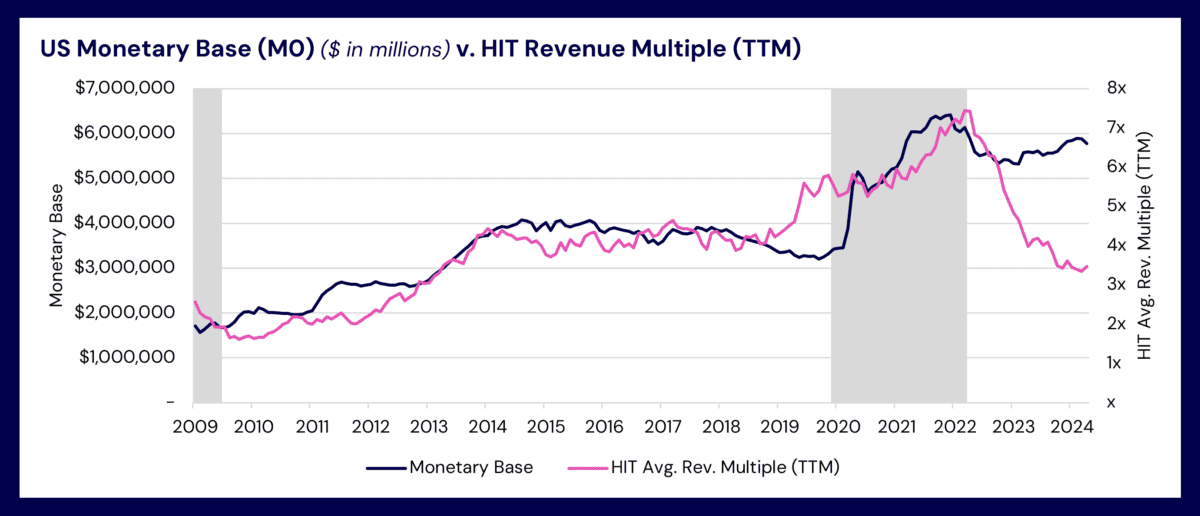
Health IT asset valuations rose in lockstep with the monetary base until very recently…
…and many asset classes appreciated at a much faster rate post-QE…
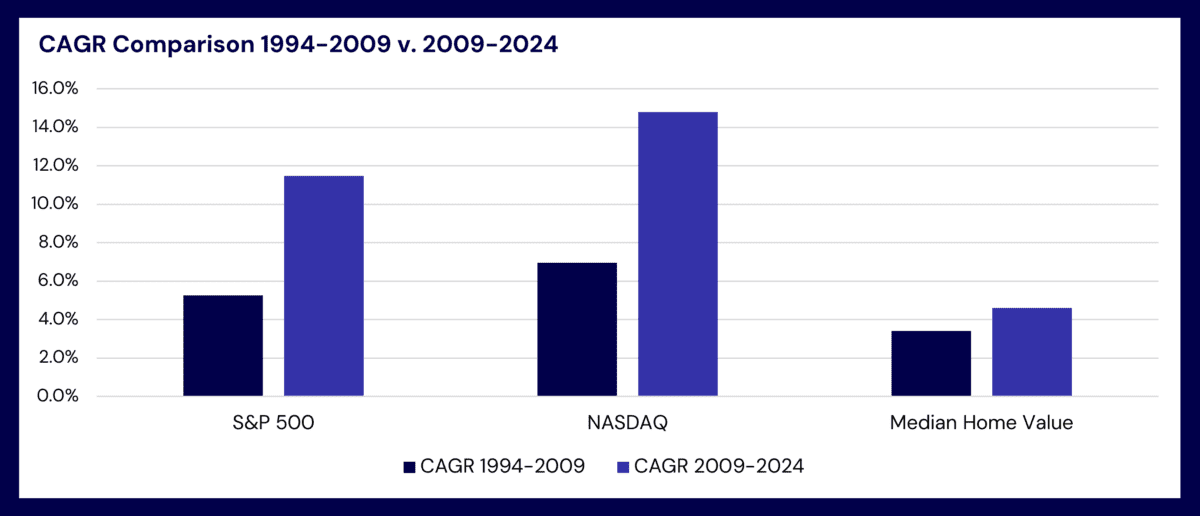
…the rise in asset prices from the monetary base was due in part to a lower cost of capital from increased bank reserves and a slower money velocity due to higher savings and investing, together dampening the inflationary impacts.
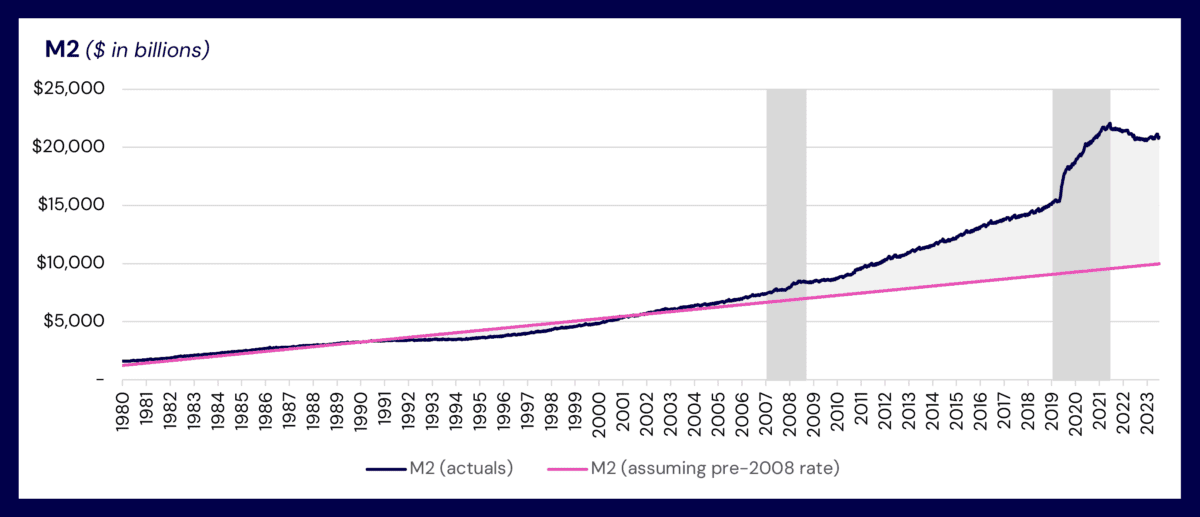
The playbook for Quantitative Easing (QE) shifted dramatically during the COVID-19 crisis. Unlike the previous decade (2010-2020), where injections primarily went through banks (still increasing M2 but with a dampening effect on inflation from lower money velocity and rising asset valuations), additional COVID fiscal stimulus bypassed banks and went straight to consumers, significantly boosting M2 (the broader money supply). This direct injection fueled a surge in both asset prices and overall inflation.
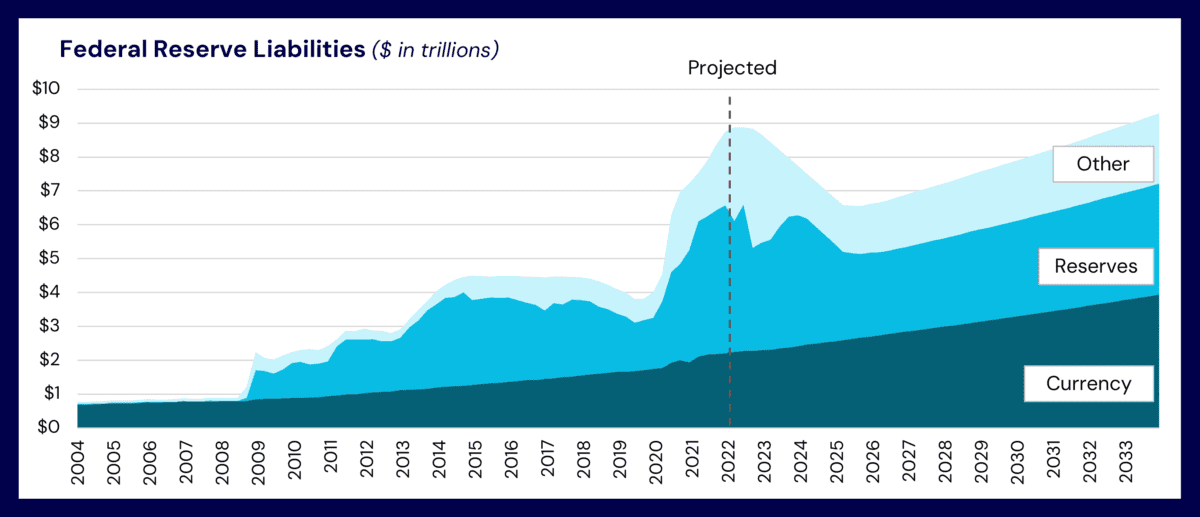
This leads to the current setup. To tame inflation, the Fed reversed its policy from QE to Quantitative Tightening (QT), a cycle expected into 2025, when the Fed is projected to return to a more normalized policy. However, going forward both M0 and M2 are likely to remain at higher levels compared to even pre-COVID times. This reflects a higher baseline for the money supply and a new baseline for inflation (inflation rates are dropping but prices are not deflating).
How far will the tide recede? Recent monetary policy shifts offer valuable insights to consider for the future:
An Unrepeatable Rising Tide: The Fed’s post-2008 interventions primarily benefitted shareholder and asset holders, whose wealth ballooned alongside the Fed’s expanding balance sheet. Notably, inflation stayed subdued as much of the new money remained within the financial system (M0), limiting its impact on broader money supply (M2) until COVID. However, replicating this QE strategy risks igniting uncontrollable inflation or pushing asset prices to unsustainable levels. In simpler terms, the rising tide that lifted all boats for the past decade is unlikely to return.
A New Watermark: The era of extraordinary quantitative easing from 2008 to 2021 may be over, but its legacy is a permanently altered landscape. The monetary base and M2 are significantly larger, reflecting a “new normal” for monetary policy. While the Fed’s current tightening aims to curb inflation with a long-term goal to return to neutral policy, it’s unlikely to shrink its balance sheet back to even pre-COVID levels. The tide of monetary stimulus may recede, but it will do so from a historically high watermark.
Perception vs Reality for Health IT: The shift in policy, however, may not perfectly align with market perception. The temporary monetary contraction feels tighter due to the recent expansive period, even though M0 and M2 are projected to rebase at historically high levels.
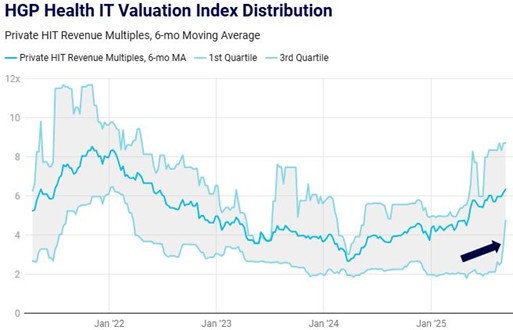
During the period of monetary base expansion, Health IT valuations also increased in near-perfect symmetry. As the market has entered a tightening cycle, Health IT valuations have fallen more dramatically than the overall money supply (M0). An overcorrection or new normal?
While current market sentiment towards Health IT may be more negative, the data might paint a more optimistic picture. The permanently elevated monetary base could act as a buffer during the tightening cycle, potentially limiting the downside for asset prices, including Health IT. Given the potential overcorrection, there’s a possibility (or hope) that Health IT valuations rebound toward a level that reflects this still-high monetary base. This highlights that a shift in market sentiment holds as much weight as the policy shift itself.